How Vertical Partitioning and Deep Joins Kill Parallelism
 Query plans with deep joins trees are often the result of high levels of normalisation in the data model. There are large advantages to normalising data as it minimizes the amount of data that must be written when a change happens. In traditional OLTP systems, this can be a boon.
However, normalisation is not without its costs – especially not in read intensive workloads like data warehouses.
It is time we turn to the issue of true vertical partitioning and deep join trees. In a previous post I described how column stores achieve very high brute force scans and filters and how they make use of the underlying sort order of data to achieve high compression.
Let us have a look at how normalised data and narrow tables fare with regards to parallelism.
Test Case
For this test, I will use the TPC-H dataset. This old warehouse benchmark is classified by a normalised structure representing sales transactions. In an OLTP system, this model might be a good idea (it is crazy for data warehouses) so let us treat it as OLTP data for this purpose. This test case also represents a “best case” scenario for normalisation.
The query we will look at is a SELECT statement that fetches a single order from the database:
SELECT P_NAME, C_NAME, L_QUANTITY, P_PARTKEY, C_CUSTKEY
FROM LINEITEM
JOIN ORDERS
ON L_ORDERKEY = O_ORDERKEY
JOIN CUSTOMER
ON C_CUSTKEY = O_CUSTKEY
JOIN PART
ON P_PARTKEY = L_PARTKEY
WHERE L_ORDERKEY = 103 AND L_LINENUMBER = 1
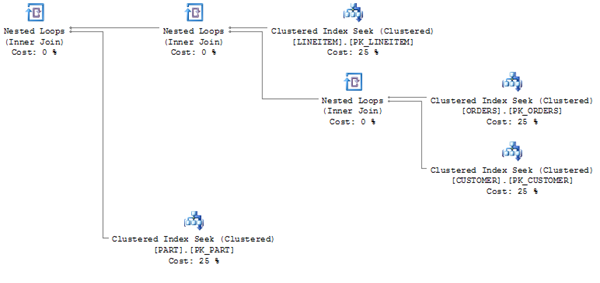
A quick look at the query plan for this reveals the expected loop join tree:
This is actually a relatively small join tree, but it is enough to illustrate the point. Let us reason a bit over this query shape.
Initial Observations
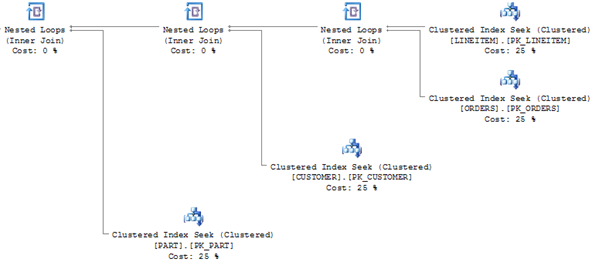
Notice something interesting about the join tree? Why is it a “bushy” tree? Why are we not getting this “right only” plan shape instead:
To answer this, we must consider the ordering that has to happen to execute the query:
1) Find the relevant row in LINEITEM with index seek
2) Find the matching row in ORDERS with index seek using L_ORDERKEY
3) Find the matching row in CUSTOMER with index seek using O_CUSTKEY
4) Find the patching row in PART with index seek using L_PARTKEY
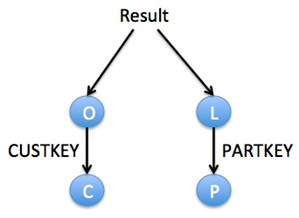
1 and 2 can happen in parallel, since LINEITEM and ORDER share the same key which is given by the query. But, and this is important: We cannot execute step 3 until we have found the relevant O_CUSTKEY in ORDER. Similarly, we cannot execute step 4 until we have found the relevant L_PARTKEY in LINEITEM.
A visualisation may explain this better. This is the execution order enforced by the normalisation of the data.
Notice that LINEITEM and ORDERS can ONLY be queried in parallel because they share the key we are filtering on. If we made the query even a little more complex, this parallelism would go away too. The query optimiser does the best it can under the conditions and make a bushy tree as we saw.
Yet no matter how you put it, enforcing ordering of work is bad news for parallelism. Let us see how this expresses itself when we execute the query.
Recall that we have to crawl a B-tree from the top to the leaf to find a single row when we loop join.
Side Note: You may also want to consider that when we use temporal modeling with many From/To dates, loop joins are often the only way to ensure a good plan search space (see comments on my blog about the Dangers of BETWEEN joins)
Crawling B-trees is expensive from a CPU perspective. Every time we fetch a non leaf node in the tree, we have to parse the tree specific data there. Not until we have decoded the non leaf node can we fetch its child node. In my blog about level 2 cache effects I showed you how this random fetch will cost you at least 50 CPU cycles (more on a NUMA system).
It used to be the case that this memory crawling would be drowned out in the time it takes to read the disk when you hit the leaf node. But with modern NAND devices, the time to seek the tree is becoming significant.
Quantify the Tree Climbing
We will use SQL Server for this case study, but the decreased parallelism insight you can gain here applies equally to all databases.
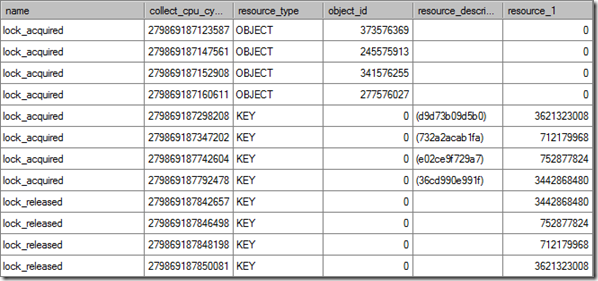
Unfortunately, SQL Server does not allow us to catch each tree crawl event on a page-by-page basis. But we can infer the tree crawl time by measuring the time between lock events. Lock events are exposed in XEvents under the lock_acquire and lock_released events. If we execute the test case SELECT statement in SERIALIZABLE isolation level, we can see when each leaf level lock (which is required to enforce this behaviour) is acquired.
At this speed, measuring clock time is not granular enough to quantify the time taken. Instead, we rely on CPU clock ticks which are exposed by the XEvent trace framework.
Here is the output of executing the SQL Statement:
To decode the exact table names you will have to use the undocumented %%lockres%% column. This allows you to translate between the hash values for the lock (second to last column). We can get the hash codes for each locked KEY entry by running this statement:
SELECT ‘LINEITEM’, %%lockres%% FROM LINEITEM
WHERE L_ORDERKEY = 103 AND L_LINENUMBER = 1
UNION ALL
SELECT ‘CUSTOMER’, %%lockres%% FROM CUSTOMER
WHERE C_CUSTKEY = 29101
UNION ALL
SELECT ‘PART’, %%lockres%% FROM PART
WHERE P_PARTKEY = 194658
UNION ALL
SELECT ‘ORDERS’, %%lockres%% FROM ORDERS
WHERE O_ORDERKEY = 103
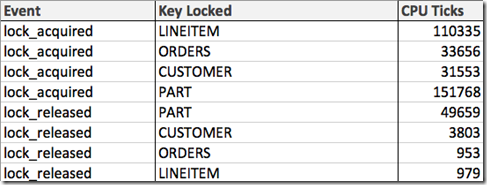
Using the XEvent trace and the lock decoding, we can now create this table:
As you can see, a significant amount of CPU cycles have been run between each request from the loop join path. Of course, some of this is work required to parse the rows and acquire the lock. But a lot of it is also wait time for memory fetches in the tree
Now, imagine this same situation in a scale-out system where the rows you need are no longer in local memory but have to be ferried across a network, adding even MORE latency to the fetch. It should be clear that dependencies like these are not good for you. In contrast, you can get away with horizontally partitioning the data (as the loops now become independent of each other) – but vertical partitioning really kills your concurrency.
Summary
In this blog, I hope I have made it clearer why large join trees and vertical partitioning build in dependencies in the data model which can significantly reduce parallelism. Normalisation has many merits when it comes to minimising the amount of writes required to keep data up to date. But if you are after high speed reading (as you are in a data warehouse) – the price of reconstructing the row from many joins becomes restrictive.
Also, note that in an OLTP system that needs very low latency on reads, having deep join trees set and upper bound on how fast you can go.
As with all high scale designs, the key to concurrency is to eliminate shared resources and to remove dependencies between threads in the execution path. High normalisation is NOT the way forward here because it CREATES dependencies instead of eliminating them. There is no way around good old Amdahl’s Law.
Excellent, Thomas! As usual.
Thanks Pedro. That is very kind of you
As usual, very thought provoking and I look forward to moving to an environment where i can do some column store testing later this year.
Incidentally, is the switch of the clustered index seek and nested loop operator in the second image to test your readers powers of observation? 🙂
Andrew: The switch in the second illustration was to illustrate how the join tree would look if it was not bushy.
I am working on some more column store posts, so please feel free to reach out when you start testing
Ahh, I see it now.
I look forward to reading your next post and will reach out, thanks.
Great stuff, Thomas! Have you posted the schema or T-SQL script that creates your sample database? Best regards, -Kev
hi Kevin
I am just using the basic DBGEN from the TPC website
Interesting that you refuse to publish my comments. I am sorry that you feel so strongly as to publish something you will not accept a critical review on.
Dan, apart from this comment I have only seen one comment from you. I am eagerly awaiting them.
Let me check my WordPress spam filter too, may have gotten in there
Ok, must have missed it then. here are a few thoughts:
1) nested loops are slow. nested loops always run sequentially. nested loops do not take advantage of parallelism nor partitioning, and if this case did – the plan would show parallelism steps
2) please post the hardware and software configuration you are running SQLServer on. It is very difficult to understand the performance you are getting without knowing what infrastructure you are running on. ie: 64 bit, 32 bit, number of core’s, speed of cores, amount of RAM, NAS/SAN/DASD/SCSI/SATA, RPM of disks, # of spindles, Raid Configuration
3) clearly there are some performance issues here if your joins are not taking advantage of the parallelism available in SQLServer2008 R2 Enterprise Edition. I see parallelism executed all the time on my i7-quad core x2 cpu @2ghz, 16GB RAM, windows 64 bit, SQLServer 2008 R2 Enterprise 64 bit, on internal SATA II 7500 RPM single disk, no RAID.
4) SQLServer is notorious for “liking” clustered sequence numbers. It appears as though your joins are not taking advantage of clustering, so I am wondering what tuning has been done to your SQLServer instance (or is this a default install)?
5) I disagree with you that joins and normalization are the problems: if the joins and normalization of data models were the source of the problem, then Teradata would not have a market today. Teradata works best on normalized models, and applies MPP principles in the hardware layers along with partitioning and parallelism to make the joins work. I do not agree with your statements that the Joins and the normalizations are the issue here. See my blog post here: http://danlinstedt.com/datavaultcat/mathematics-of-joins-denormalization-rows-per-block-and-io/ for more information. at the end of the blog post, I reference mathematical articles written about normalization and de-normalization that help support and clear the case. Also, I believe if joins were the problem, we would not see such huge success with Hadoop across multiple platforms (map-reduce, and so on), nor would we see such huge success with columnar databases – these live off joins, yes – every column is joined. In effect it’s 6th normal form. They provide boosts to performance again through hardware and software algorithms, along with compression and data reduction techniques.
In conclusion: i do not believe that the claim you made about high normalization being a problem, has been justified.
I would love to see these statistics on an Enterprise class SQLServer 2008 R2 clustered environment that has been properly tuned, as well as on an Oracle Exadata V2 machine, a DB2 UDB MPP edition, and a Teradata box. I would then urge you to take these queries to a columnar database and see what happens. These are the statistics that would make it interesting.
Remember this: there is an upper limit to denormalization as well. Too much denormalization and rows get too wide, once there are too few rows per block (the ratio becomes skewed) then I/O begins to rise again. Once this happens, any further denormalization will literally log jam the I/O calls – (blocked I/O) causing the CPU to go in to idle states, but still eating cycles. Rows that are too wide / too denormalized will also cause a tremendous increase in fragmentation (through row-chaining).
Now that said: I believe there is a fine balance between normalization and denormalization – until or unless you have hardware and firmware setup (like the columnar databases) to take advantage of 6th normal form modeling techniques.
Hope this helps,
Dan Linstedt
Dan, I checked my spam filter too. Your comments are not there either. Did you post them here on this blog?
Hi Dan
Glad the commenting works now. You make a lot of points and I will address them all when I have more time to sit down. But let me provide a few quick answers:
Dan:
1) Nested loops are slow. nested loops always run sequentially. nested loops do not take advantage of parallelism nor partitioning, and if this case did – the plan would show parallelism steps
Thomas:
Nested loops CAN take advantage of parallelism if the input is horizontally parallelised. That being said, they are still a lot slower than hash lookups.
Dan:
2) Please post the hardware and software configuration you are running SQLServer on. It is very difficult to understand the performance you are getting without knowing what infrastructure you are running on. ie: 64 bit, 32 bit, number of core’s, speed of cores, amount of RAM, NAS/SAN/DASD/SCSI/SATA, RPM of disks, # of spindles, Raid Configuration
Thomas:
This one runs purely from memory. Running it on top of a FusionIO powered 400.000 IOPS capable server (which I have) gives us best case: around 100 microsec for the IOPS, but the CPU clock time for the query is actually HIGHER than that (the tree walk dominates). Please note that my point is true for any hardware configuration, you cannot throw hardware at restricted parallelism.
Dan:
3) clearly there are some performance issues here if your joins are not taking advantage of the parallelism available in SQLServer2008 R2 Enterprise Edition. I see parallelism executed all the time on my i7-quad core x2 cpu @2ghz, 16GB RAM, windows 64 bit, SQLServer 2008 R2 Enterprise 64 bit, on internal SATA II 7500 RPM single disk, no RAID.
Thomas:
You are missing the point. The parallelism is restricted because of the plan shape. If i fetched a millions of rows (and not a single one like above), the server would do horizontally partitioned parallelism. But even then, I would still not change the price of the loop join (which would now being to dominate the runtimes, as the scan will be super fast) and the dependencies created by it.
Dan:
4) SQLServer is notorious for “liking” clustered sequence numbers. It appears as though your joins are not taking advantage of clustering, so I am wondering what tuning has been done to your SQLServer instance (or is this a default install)?
Thomas:
The plans above show that the engine IS taking advantage of the clustering. Using heaps with non clustered indexes (like Oracle likes to do) leads to exactly the same conclusion.
With regards to your point 5: This requires a much larger answer. As you note in the blog entry, you are taking a very simplified approach to the maths. Once you consider parallelism and pipeline, you can no longer add up the latency of the disk like you do, adding up disk blocks like that is not the way to predict query performance.
With regards to your claim about column stores being 6NF (and all the conclusions you derive from it): I would encourage you to read up on the links i added to my other reply. If you believe that wide tables are a problem as you describe, then I am sorry to say, you are really not understanding what a column store is. We can walk through some examples if it will help.
With regards to Map/Reduce being a good argument for normalisation: The opposite is true in a lot of a situations as people are discovering. Here are some examples:
http://highscalability.com/scaling-secret-2-denormalizing-your-way-speed-and-profit
1) It has been my experience that SQLServer when it runs parallelism – shows parallelism in the query plan. In the plans that I run, I do not see nested loops, I see parallelism followed by hash / merge joins. If you say that nested loops do take advantage of parallelism, then why isn’t the query plan showing it?
You state it takes advantage of parallelism in horizontal partitioning, then is your data set horizontally partitioned? And by which key(s)? And if it is partitioned, then why does the query plan not show the use of the partitions?
2) I am not throwing hardware at restricted parallelism. I am merely making the point that some hardware and infrastructure components such as column stores take advantage of firm-ware, high speed network backbones, high speed disk, caching mechanisms and the hardware underneath. Otherwise you would *not* see successful Teradata environments in a highly normalized data model sitting in the petabyte ranges.
3) you are correct – the price of the loop is a problem. However in the query plans that I execute on normalized models (including 3nf) I tend to see a lot more hash join, and sorted merge joins than you have demonstrated with this small example. From all the performance and tuning articles I’ve read and the practices I’ve seen – common sense says that hash joins are faster than nested loop joins. This has been proven over and over again. So the real question is: why do you insist on using a nested loop join as an attempt to discredit normalized data models? Clearly, this example does not take in to account hash join, heap join, or sorted merge join – all of which operate at different rates and as such have different costs.
4) Ok, yes, it is using clustering, but the plan still does not *show* parallelism. Again, in my experience with SQLServer2008 R2 Enterprise – every time it introduces parallelism, it shows it in the plan, so what is missing from this example that it does not appear?
5) True – I use simple math to prove a real-world point. I’ve executed these scenarios over and over again, and time and time again – parallelism (when executed properly in the right environment) is faster than non-parallelism. Please check the articles I reference at the bottom of my post get in to the details of the mathematics of normalization, MPP, and parallelism. They were written by much smarter people than I am, and cover the topic in painful detail.
It seems that the question of normalization and parallelism is still left unanswered by your post. Especially with regard to Teradata, Oracle Exadata R2, DB2 UDB MPP, and even clustered instances of SQLServer 2008 R2 Enterprise Edition with partitioning turned on.
The post and the case that is listed here does not go far enough to prove that normalization causes performance problems.
However, as I stated in my last response: both over-normalization, and over-denormalization cause problems with performance with specific regards to a traditional relational database engine.
You may be right, I may not be an expert in column based data stores, but do have experience with Sybase IQ, and Paraccel. It is my understanding that the name “Columnar data store” refers to the physical separation of each column – therefore, it may not conform to 6th normal form, but it is as normalized as you can possibly get the data without going further (at least technologically today).
My statements about wide data stores are strictly related to Relational Database Engines, they have nothing to do with columnar data stores. Both you and I (I am sure) have seen tables with logical definitions of over 1000 columns in a columnar data store.
My point with columnar data stores is that they perform normalization to the maximum, and they run joins to put the data set back together. So again, the argument that is put forward in this blog entry (about normalization being the cause for performance problems) is diametrically opposed the nature of columnar data stores and how they work.
Thoughts?
Dan, I wondering if I am still not seeing your comments. Are you trying to post a response to my reply below? Please do feel free to ping me on Twitter if you have issues with getting the post on the site (my Twitter alias is: @thomaskejser)
1) I think I need to show you another example of what happens when horizontal partitioning kicks in. You can benefit from horizontal partitioning of the query WITHOUT having partitions set up in the table. SQL Server (unlike, for example, older versions of Oracle) will run “intra table parallelism”. Think of it like this: If you have a table with 8 pages and you have two cores, you can now have each core scanning 4 pages (without having to partitioning the table first) and gain parallelism that way (the pages are independent). But that does not save you you if your join trees are deep, because you CANNOT do one join in the tree until the higher joins have been done (though you can pipeline, but that does not give you the full benefits)
2) Teradata lives in the PB range largely because they were one of the first engines to introduce a scaled-out warehouse engine before anyone else had it. They have one of the most advanced optimisers in that space. But you don’t need special hardware to do this as Greenplum and SQL Server PDW, Vertica are examples of. Now, just because there EXIST Teradata installations that are normalised, doesn’t mean it is a good idea. I have seen Teradata super sized setups that are denormalized which performance very well and I have outcompeted Teradatas performance when the customer insisted on normalisation and I could achieve the same performance without even having to scale-out. That being said, specialised hardware adds and additional bump up in performance.
3) First, you can’t always get away with a hash join if you are joining two large tables together (because it takes more memory to do this) – and normalisation increases the occurrence of big/big joins. Second: Loop joins are often the safest way for engine to evaluate BETWEEN predicates – because these mess with the cardinality estimation as described in a previous blog post. The argument here actually flies for other join types too, but loops joins are the worst case and are more likely to occur in a normalised model than in a star schema.
4) Again, parallelism could have been introduced if we fetched more rows, but it still would have changed the equation. Reiteration: you cannot fetch CUSTOMER until you have fetched ORDERS. No amount of parallelism, neither in the query nor in the storage engine
5) I am familiar with the argument about reducing I-O Dan, but I am telling you it is misguided. For several reasons:
– You CANNOT add up latency to get full runtime in a parallel environment (though you CAN set a limit to how fast you can go if you have a deep join tree)
– You CANNOT assume that the I/O cost will dominate the runtime anymore, those days are over (today, you can shovel data so fast to the CPU core that your runtime is dominated by the computation you have to run – like joins for example)
– You CANNOT assume that just because a table is wide, every row fetch has to fetch all the bytes in the table (that is what column stores are for)
So, you math checks out only under premises that are simply not true for a modern database engine.
5) Most column stores today ARE relational database engines. Take SQL server as an example, a column store here is just another type of index. It’s a different way to store the data, not a different database paradigm.
With regards to normalisation of column stores:
Just because you store columns individually does not mean you removing all redundancy as you would in 6NF. Each column in a column store may (and most often will) contain repeated instances of each value in the domain. The repetitions are just laid out in such a way as to boost scan speed.
To reconstruct rows, you need to do a form lightweight merge join (but one where you can skip ahead a lot). Note that this never requires a sort, because all columns are ordered the same way on disk: Namely in the order the ROWS were originally ordered in. Interestingly, this means that you can actually boost compression not a column store by cleverly sorting the rows before you column store compress them (something I will be blogging about).
Just to make sure we agree on the properties of column stores:
– That I/O fetches are proportional with the number of columns requested, NOT on the original row width (one of the things that make your math invalid)
– That filtering (including bloom filters to improve join performance) and indeed some aggregates can be done VERY efficiently before the “row reconstruct merge join” is performed, more efficient than the same calculation on a row.
– That the row reconstruction time is always upper bounded by the original row count. It is O(n)
– That compression is higher than same data stored in a row store. And hence, less I/O is required to fetch data.
With regards to proving that vertical partitioning and deep joins give you issue with parallelism: I agree there are many more cases that can be used and the argument has many variants, I would not call my observation here a proof…. I am curious about your opinion in this context: Do you claim that there are cases where joins and vertical partitioning INCREASE parallelism?